Office work
Processing & 3D Inversion
Rigorous processing and constrained 2D/3D inversion of magnetic, gravity, IP/resistivity and NMR data, including third-party and legacy datasets.
A survey is only as good as its processing. Our processing team turns raw field data into grids, sections and 3D models that geologists can use, with the assumptions and uncertainty written down.
Processing
- Magnetics: diurnal and IGRF correction, levelling, reduction to pole, and derivatives (vertical derivative, tilt, analytic signal) that sharpen edges and structure.
- Gravity: drift and tide removal, full Bouguer and terrain corrections, regional-residual separation.
- IP and resistivity: quality filtering, decay-curve checks, 2D and 3D inversion of chargeability and resistivity.
- ERT and VES: inversion to layered or 2D models, with depth of investigation shown so nobody over-reads the deep part.
- NMRS: inversion of the sounding curves to water content and decay time with depth.
Constrained inversion
An inversion finds a model of the ground that explains the measured data. Many models can explain the same data, so we include what is already known: drill-hole lithology, measured rock properties (petrophysics), mapped contacts and depth to cover. The model stays realistic rather than mathematically convenient.
Third-party and legacy data
We also reprocess older surveys and government datasets, and review other contractors' data before you rely on it. Old data reprocessed with modern methods often shows targets that were missed the first time.
What you get
Grids in GeoTIFF and Geosoft formats, located line data, 3D voxel models ready for Leapfrog and similar software, iso-surfaces for drill targeting, and a report that explains every step.
Sample output
What you get back
An example of the kind of figure that goes into the report. The data here is synthetic, made to show the method, not taken from a client job.
A slice through a 3D magnetic inversion: the source body and its alteration ring, placed at depth. Generated for illustration; not client data.
In the field
How it looks on the ground
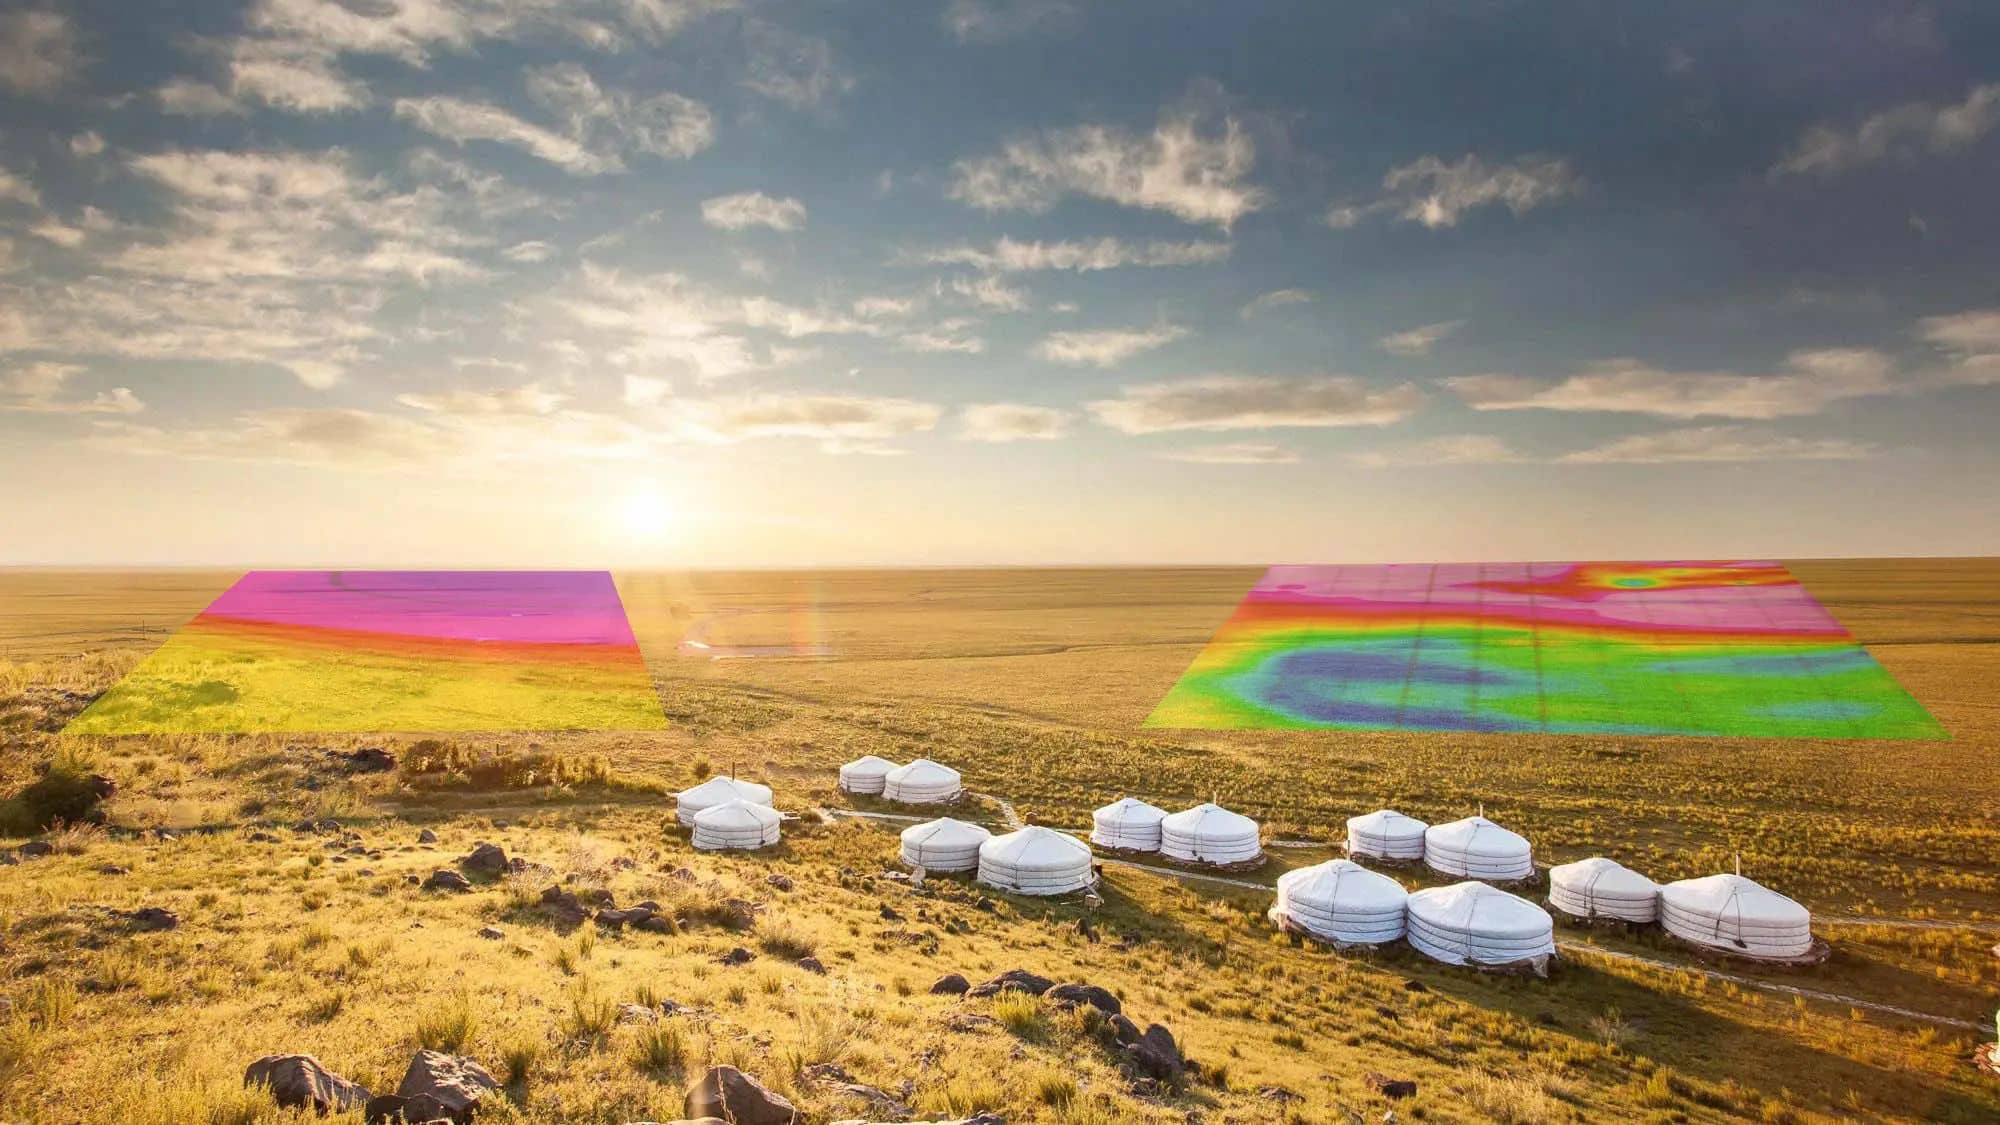
From readings to grids
Every station we read ends up as a pixel in a grid like these, and every grid as part of a model.
Other methods · Office work
Send us a licence boundary.
A shapefile or a sketch on a map is enough. Tell us what you're looking for and we'll come back with a method, line spacing and price, usually within two working days.
Start a quote→