Field acquisition
Gravity Surveys
Precision ground gravity to map density contrasts such as basins, intrusions, massive sulphides and kimberlites.
Gravity measures tiny changes in the pull of the Earth caused by differences in rock density. Dense bodies such as massive sulphides, mafic intrusions or bedrock highs pull slightly harder; sedimentary basins, faults filled with gouge and light granites pull slightly less. The differences are a few parts in ten million, so the method lives or dies on careful fieldwork.
How it works
Each station is read with a Scintrex CG-5 gravity meter, which levels itself, corrects for tilt and averages out ground vibration. Emlid RTK GNSS gives the station height to a couple of centimetres, which matters: an error of 1 cm in height is about 3 microGal in gravity. Every loop starts and ends at a base station so we can remove instrument drift and tides.
Corrections
Raw readings become a Bouguer anomaly map after corrections for latitude, height (free-air), the rock between station and datum (Bouguer) and the surrounding terrain. In the Altai, Khangai and Gobi-Altai mountains the terrain correction is large, so we combine near-station field estimates with a detailed digital elevation model.
What it finds
- Basins and depth to bedrock: the main use for water and coal work.
- Dense ore bodies: massive sulphides and some iron deposits.
- Intrusions and structure: the regional framework that magnetics alone can miss, especially where rocks are not magnetic.
Quality control
- Base readings at the start and end of every loop, and repeat stations each day.
- Drift and tide checked before the crew leaves the area.
- Height and position checked against GNSS base logs.
Limits
Gravity is slower per station than magnetics and needs accurate heights, so it is usually run on a wider grid. On its own it gives density contrasts, not rock types, so it is best read alongside magnetics and geology.
Sample output
What you get back
An example of the kind of figure that goes into the report. The data here is synthetic, made to show the method, not taken from a client job.
A sedimentary basin shows as a broad low on the left; a dense intrusive body gives the tight high to the north-east. Generated for illustration; not client data.
In the field
How it looks on the ground
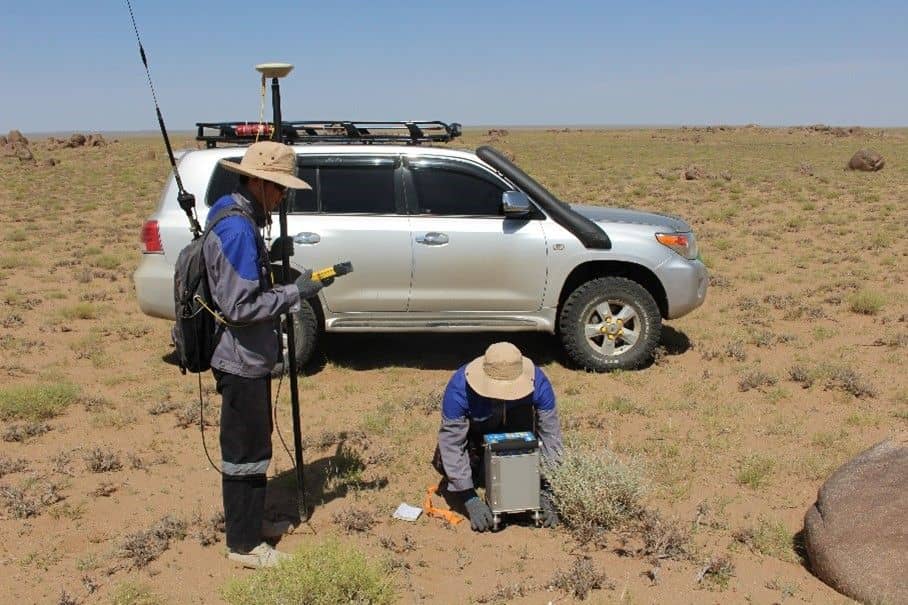
Gravity station
Gravity reading and GNSS height together: a centimetre of height error is about 3 microGal of gravity.
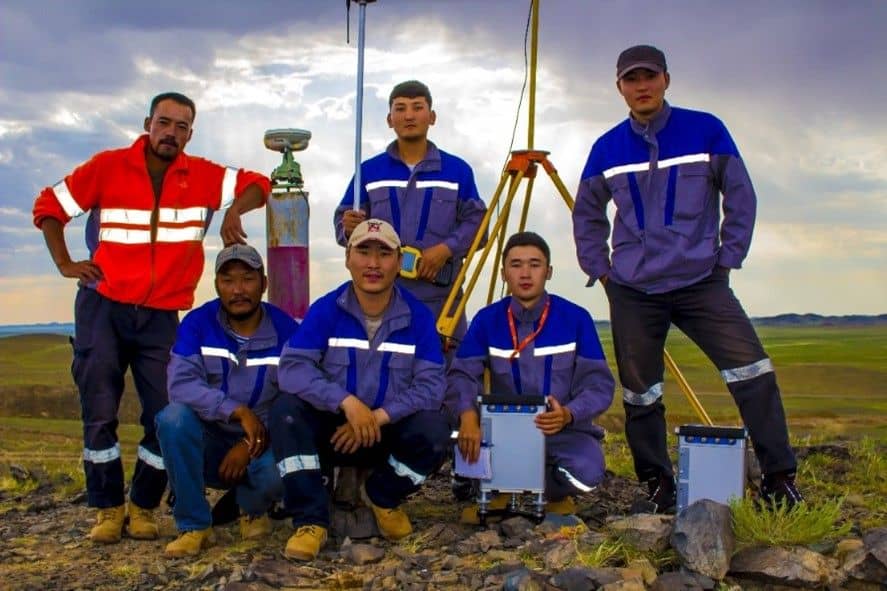
End of the day
Last base reading done, data checked and the crew heads back to camp.
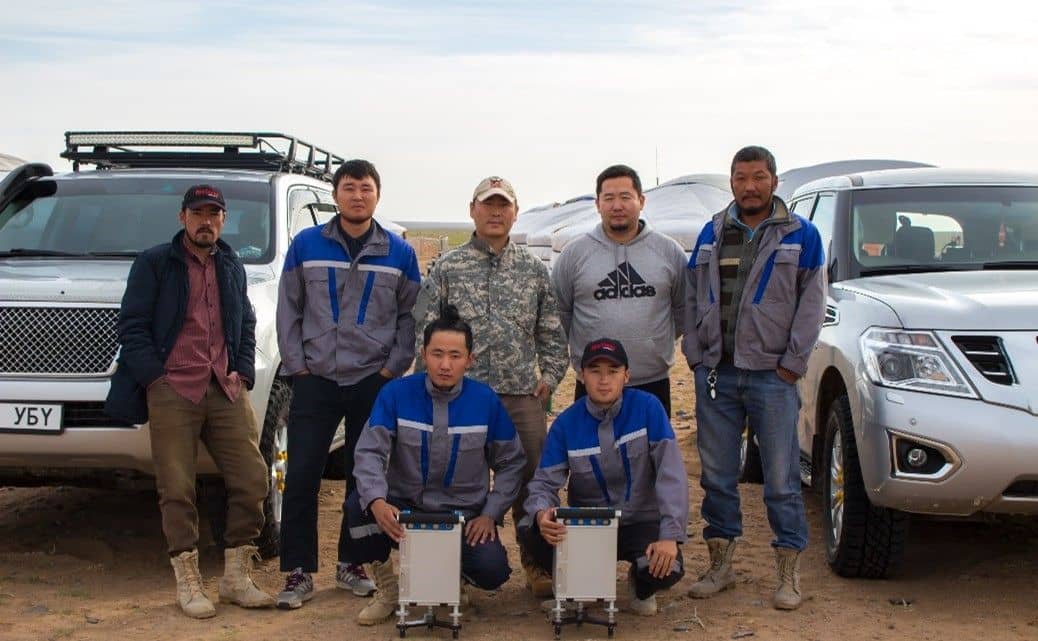
Gravity crew
Two CG-5 meters in the field let two teams read stations at the same time.
Where we’ve used it
Other methods · Field acquisition
Send us a licence boundary.
A shapefile or a sketch on a map is enough. Tell us what you're looking for and we'll come back with a method, line spacing and price, usually within two working days.
Start a quote→